Key Economic Indicators and How to Read Global Trends
Master Economic Indicators: Your Complete Guide to Understanding Global Market Trends
Hey there, future financial experts! 📈 Ready to decode the economic puzzle that drives your investment returns and shapes your financial future? You’re in for a treat! Today, we’re diving deep into the world of economic indicators – those powerful data points that smart investors use to stay ahead of market trends and make profitable decisions.
Whether you’re building your first investment portfolio, running a business, or simply want to understand why your 401(k) keeps fluctuating, mastering these economic indicators will give you a significant edge. Let’s turn you into an economic trend-spotting machine!
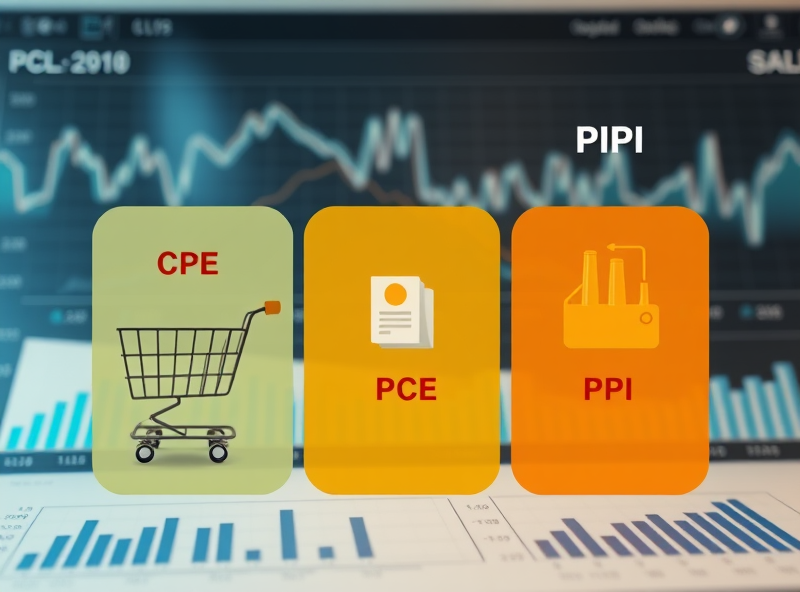
The Big Three Inflation Indicators: Your Price Movement Compass
Understanding inflation isn’t just for economists – it’s absolutely crucial for your financial success! These three inflation indicators will help you predict everything from mortgage rates to grocery bills, and most importantly, protect your hard-earned money from losing its purchasing power.
Consumer Price Index (CPI): The Household Budget Barometer
Think of CPI as your personal cost-of-living detector. This indicator tracks how much more (or less) you’re paying for everyday items compared to last year. The Bureau of Labor Statistics creates a “shopping basket” filled with typical American purchases – from gasoline and groceries to healthcare and housing.
Why CPI Matters to Your Wallet:
- Salary Negotiations: Many employers use CPI to justify raises
- Social Security Adjustments: Your benefits are adjusted based on CPI changes
- Investment Strategy: Rising CPI often signals that interest rates might increase
- Real Estate Decisions: CPI helps predict housing cost trends
Smart Money Move: When CPI is rising rapidly (above 3-4% annually), consider Treasury Inflation-Protected Securities (TIPS) or real estate investments that historically keep pace with inflation.
Personal Consumption Expenditures (PCE): The Fed’s Favorite Tool
The PCE is like CPI’s more sophisticated cousin. While CPI asks, “How much are the same items costing?” PCE asks, “How are people actually spending their money?” This flexibility makes it the Federal Reserve’s preferred inflation measure.
What Makes PCE Special:
- Behavioral Adjustments: If beef prices soar, PCE captures when people switch to chicken
- Broader Coverage: Includes services that businesses pay for on your behalf (like employer-provided healthcare)
- Policy Impact: The Fed targets 2% PCE inflation, making it crucial for predicting interest rate changes
Investment Insight: When PCE consistently exceeds the Fed’s 2% target, expect potential interest rate hikes that could affect your bond investments and mortgage rates.
Producer Price Index (PPI): Your Early Warning System
PPI is like having a crystal ball for consumer prices. It measures what manufacturers pay for raw materials and production – costs that eventually trickle down to retail prices. Smart investors watch PPI to get ahead of consumer price trends.
PPI’s Predictive Power:
- Supply Chain Insights: Rising commodity costs often lead to higher retail prices 3-6 months later
- Sector Analysis: Helps identify which industries might face margin pressure
- Investment Timing: Can signal when to rotate between growth and value stocks
Pro Tip: Rising PPI with stable CPI often indicates companies are absorbing costs temporarily – a situation that can’t last forever and usually leads to consumer price increases.
GDP and PMI: The Economic Health Check-Up You Need
Understanding economic output isn’t just academic – it directly impacts your investment returns, job security, and business opportunities. Let’s decode these essential indicators that drive market sentiment and investment flows.
Gross Domestic Product (GDP): The Ultimate Scorecard
GDP measures everything a country produces – it’s like a giant cash register ringing up the entire economy. But here’s the thing: GDP data comes out months after the economic activity actually happened, making it more of a confirmation than a prediction tool.
GDP’s Four Components (Remember C+I+G+NX):
- Consumer Spending (C): About 70% of U.S. GDP – this is your shopping power!
- Business Investment (I): Companies buying equipment, software, and buildings
- Government Spending (G): Federal, state, and local government expenditures
- Net Exports (NX): Exports minus imports
Investment Applications:
- Stock Market Correlation: Strong GDP growth typically supports higher stock prices
- Currency Impact: Growing economies often have stronger currencies
- Sector Rotation: Different GDP components favor different investment sectors
Purchasing Managers’ Index (PMI): The Fortune Teller of Economics
PMI is based on surveys of purchasing managers – the people who buy raw materials for manufacturing companies. It’s released monthly and provides real-time insights into economic momentum.
PMI Reading Guide:
- Above 50: Economic expansion (good news for stocks!)
- Below 50: Economic contraction (time to be defensive)
- Above 55: Strong growth (potential inflation concerns)
- Below 45: Significant contraction (recession warning)
Smart Trading Strategy: PMI trends often predict stock market movements 1-3 months in advance. A consistently rising PMI above 52 has historically been bullish for equity markets.
Leading Indicators: Your Economic Crystal Ball
Want to invest like a pro? Start watching leading indicators – these data points tell you where the economy is heading before it gets there. This forward-looking approach can give you a significant edge in your investment timing.
PMI Deep Dive: Manufacturing vs. Services
Manufacturing PMI:
- Reflects industrial production, employment, and new orders
- More volatile but provides early signals of economic turns
- Particularly important for cyclical stocks and commodities
Services PMI:
- Covers the larger portion of the modern economy
- Generally more stable than manufacturing
- Critical for understanding consumer-driven economic trends
Winning Strategy: Watch for divergences between manufacturing and services PMI. When manufacturing PMI falls below 50 while services stays above 55, it often signals a “soft landing” scenario favorable for growth stocks.
Non-Farm Payrolls (NFP): The Jobs Report That Moves Markets
Released the first Friday of every month, the NFP report is like the Super Bowl for economists and traders. It measures employment changes in all sectors except farming, and it can move markets dramatically.
Key NFP Components to Watch:
- Headline Number: Total jobs added or lost
- Unemployment Rate: Percentage of workforce without jobs
- Average Hourly Earnings: Wage inflation indicator
- Labor Force Participation: How many people are actively seeking work
Market Impact Patterns:
- Strong NFP (250K+ jobs): Often bullish for stocks, bearish for bonds
- Weak NFP (under 100K jobs): Can trigger defensive positioning
- Goldilocks NFP (150K-200K): Often the “just right” scenario markets love
Trading Tip: The market often reacts more to wage growth than the headline jobs number. Rising wages can signal inflationary pressure that might prompt Fed action.
Using U.S. Data to Understand Global Economic Trends
Here’s a secret that professional investors know: you don’t need to track dozens of countries’ economic data to understand global trends. The U.S. economy is so influential that its indicators often predict worldwide economic patterns.
The U.S. Dollar’s Global Impact
When U.S. economic indicators strengthen, the dollar typically rises, which creates ripple effects:
Strong Dollar Effects:
- Emerging Markets: Higher dollar makes their debt more expensive to service
- Commodities: Most commodities are priced in dollars, so a strong dollar can depress prices
- International Stocks: Can reduce returns for U.S. investors in foreign markets
Federal Reserve Policy as a Global Driver
The Fed’s decisions based on U.S. economic data influence global markets:
Interest Rate Ripple Effects:
- Capital Flows: Higher U.S. rates attract global investment
- Currency Values: Other countries often follow Fed policy to maintain competitiveness
- Global Growth: U.S. monetary policy affects worldwide liquidity conditions
Consumer Spending: The Global Demand Engine
U.S. consumer spending represents about 15% of global GDP, making American shopping habits a worldwide economic force:
Global Impact Chain:
- Strong U.S. consumer confidence → Higher imports → Global manufacturing boost
- Weak U.S. spending → Reduced global demand → International economic slowdown
- Shifting U.S. preferences → Global supply chain adjustments
Building Your Economic Indicator Dashboard
Ready to put this knowledge into action? Here’s how to create your personal economic monitoring system:
Essential Weekly Check-ins
Monday Market Prep:
- Check weekend economic calendar for the week’s releases
- Review any Friday job report impacts still affecting markets
- Scan for any Fed officials speaking during the week
Wednesday Mid-Week Assessment:
- Analyze any PMI data released (usually first few days of the month)
- Review consumer confidence reports
- Check commodity price movements for inflation signals
Friday Wrap-Up:
- Process any NFP or CPI data released during the week
- Assess how economic data aligned with market movements
- Plan next week’s investment positioning
Your Economic Indicator Toolkit
Free Resources:
- FRED Economic Data: St. Louis Fed’s comprehensive database
- Bureau of Labor Statistics: Official source for employment and inflation data
- Bureau of Economic Analysis: GDP and consumer spending data
- ISM Reports: Manufacturing and services PMI data
Smart Apps and Websites:
- Bloomberg Economic Calendar: Shows upcoming releases and forecasts
- Trading Economics: International economic data comparison
- MarketWatch Economic Calendar: User-friendly format with explanations
Creating Your Investment Strategy Around Economic Data
Defensive Positioning Signals:
- PMI below 48 for two consecutive months
- Rising unemployment with flat wage growth
- Inverted yield curve (short-term rates higher than long-term)
Growth Positioning Signals:
- PMI above 52 with rising trend
- Strong NFP with healthy wage growth
- Expanding GDP with balanced inflation
Rotation Strategies:
- Early Cycle: Favor financials and industrials as rates rise
- Mid Cycle: Focus on technology and consumer discretionary
- Late Cycle: Shift toward healthcare and utilities for defensiveness
Advanced Economic Analysis Techniques
Cross-Indicator Analysis
Don’t rely on single indicators – the magic happens when you combine multiple data points:
Bullish Combination:
- Rising PMI + Strong NFP + Moderate CPI = Goldilocks economy
- Growing GDP + Stable PCE + Expanding PMI = Sustained growth
Warning Signals:
- Rising PPI + Stable CPI + Weakening PMI = Margin compression ahead
- Strong NFP + Rapidly rising wages + High CPI = Overheating concerns
Regional Analysis for Better Insights
Different regions of the U.S. can provide early signals:
Leading Regions:
- West Coast: Technology and innovation trends
- Texas: Energy and industrial indicators
- Northeast: Financial services and consumer trends
Seasonal Adjustments and Trend Analysis
Learn to look beyond the headlines:
Seasonal Patterns:
- Holiday retail impacts on Q4 consumer spending
- Weather effects on construction and energy consumption
- Back-to-school impacts on various sectors
Your Action Plan for Economic Indicator Mastery
Week 1-2: Foundation Building
- Set up economic calendar alerts for major releases
- Create a simple tracking spreadsheet for key indicators
- Begin following 2-3 economic indicators closely
Week 3-4: Pattern Recognition
- Start noting how markets react to different economic data
- Compare actual results to forecasts and market reactions
- Begin connecting economic data to your investment performance
Month 2: Integration
- Incorporate economic analysis into your investment decisions
- Start predicting market reactions based on economic calendars
- Develop your personal economic indicator weighting system
Month 3+: Advanced Application
- Use economic indicators for sector rotation strategies
- Incorporate global economic trends into your analysis
- Develop contrarian positions based on economic indicator divergences
Turning Economic Knowledge into Investment Success
Congratulations! You now have the tools to understand and profit from economic indicators like a seasoned professional. Remember, successful investing isn’t about predicting every economic twist and turn – it’s about understanding the big picture trends and positioning yourself accordingly.
The beauty of economic indicators is that they’re available to everyone, but few people take the time to truly understand them. By mastering these tools, you’re joining an elite group of informed investors who make decisions based on data rather than emotions or headlines.
Key Takeaways for Your Investment Success:
- Inflation indicators help you protect purchasing power and predict interest rate changes
- GDP and PMI provide the big picture of economic health and growth trends
- Leading indicators like PMI and NFP give you early warning signals for market changes
- U.S. economic data can help you understand and predict global market movements
- Combining multiple indicators provides more reliable investment signals than relying on any single metric
Start small, stay consistent, and remember that becoming an economic indicator expert is a journey, not a destination. The markets will always present new challenges, but with these fundamental tools in your arsenal, you’ll be prepared to navigate whatever economic environment lies ahead.
Your financial future just got a whole lot brighter – now go out there and make those informed investment decisions that will build lasting wealth!
Remember, economic indicators are tools for analysis and shouldn’t be your only consideration when making investment decisions. Always consider your personal financial situation, risk tolerance, and investment goals. Consider consulting with a qualified financial advisor for personalized investment guidance.